
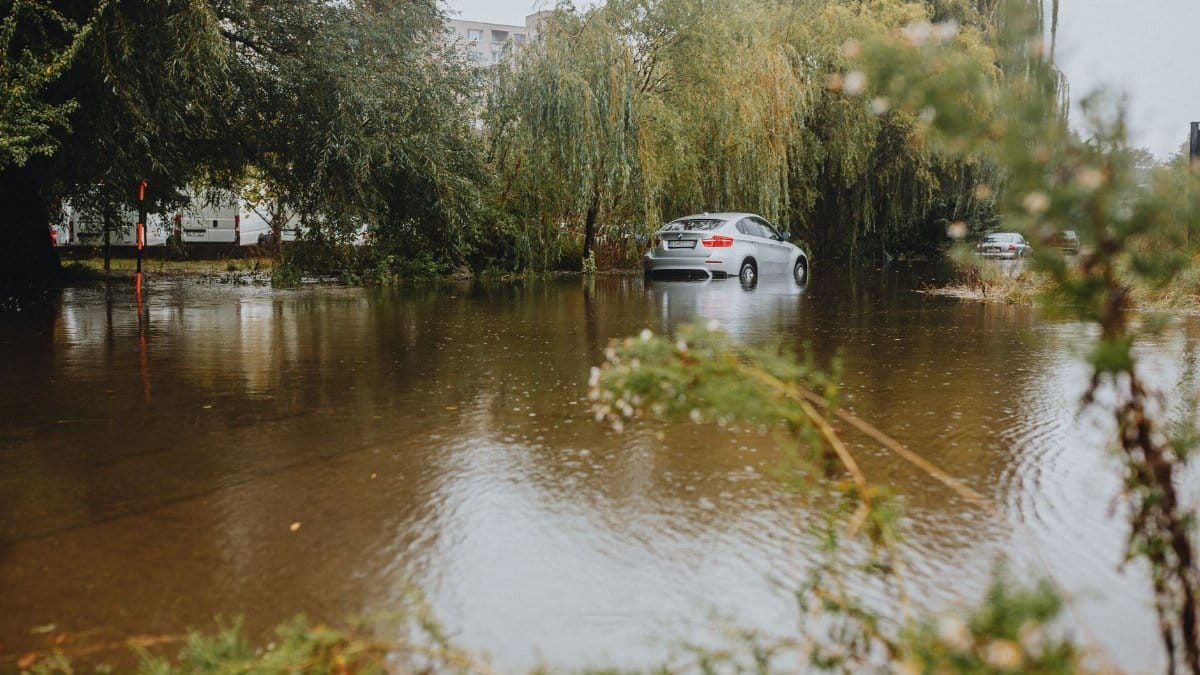
A new interactive mapping system now gives Houston area property owners clearer views of potential inundation threats than standard federal charts have offered in the past. Developed through local university research and public data partnerships the platform combines rainfall records elevation details and drainage patterns to generate custom risk scores for individual addresses. Many residents have begun testing the service after repeated storms exposed gaps in older assessment methods. The effort arrives as city leaders weigh infrastructure upgrades amid growing concerns over Houston flood risk and long term urban planning needs.
Limitations in Federal Flood Designations
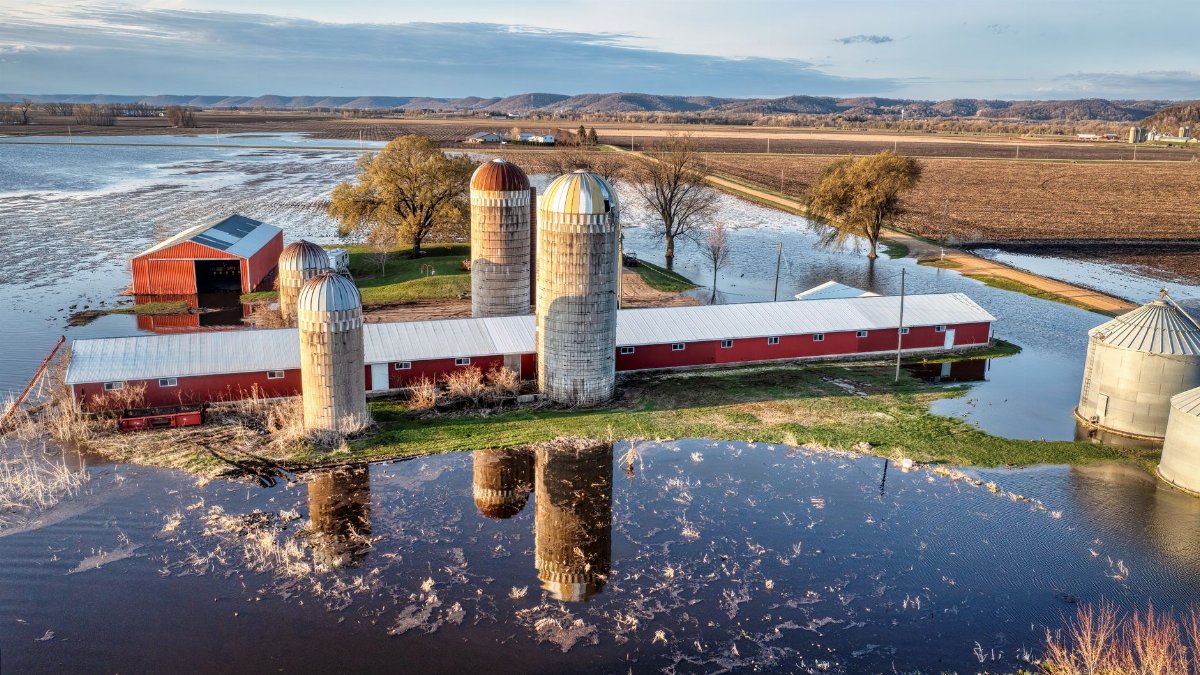
Federal maps from the national flood insurance program often rely on outdated topographic surveys that miss subtle elevation shifts or recent development impacts. In Houston these charts sometimes classify areas as low risk even when local records show repeated street flooding during heavy rains. The new tool draws on higher resolution data to adjust those estimates and reveal properties that sit just outside official boundaries yet face comparable exposure.
Features of the Interactive Platform

Users enter an address to receive side by side comparisons between federal zones and the expanded estimates. Color coded layers display projected water depths for storms of varying intensity along with historical event overlays. Downloadable reports summarize elevation profiles and proximity to bayous or drainage channels. The system updates periodically as new rainfall measurements become available from regional gauges.
Lessons from Past Storm Events

Major weather systems over the last decade demonstrated how quickly water can accumulate across flat coastal plains. Neighborhoods that escaped federal designations still suffered interior damage when drainage systems reached capacity. Analysts reviewing those episodes note that expanded modeling captures micro basins and impervious surface growth that older maps overlooked.
Insurance and Lending Implications

Property buyers and current owners often discover that standard policies do not cover events outside mapped zones. Lenders may require coverage only within federal boundaries leaving some households underprotected. The platform helps users prepare for conversations with insurers by providing supplemental documentation that explains elevated exposure levels beyond official lines.
Community Planning and Infrastructure Responses
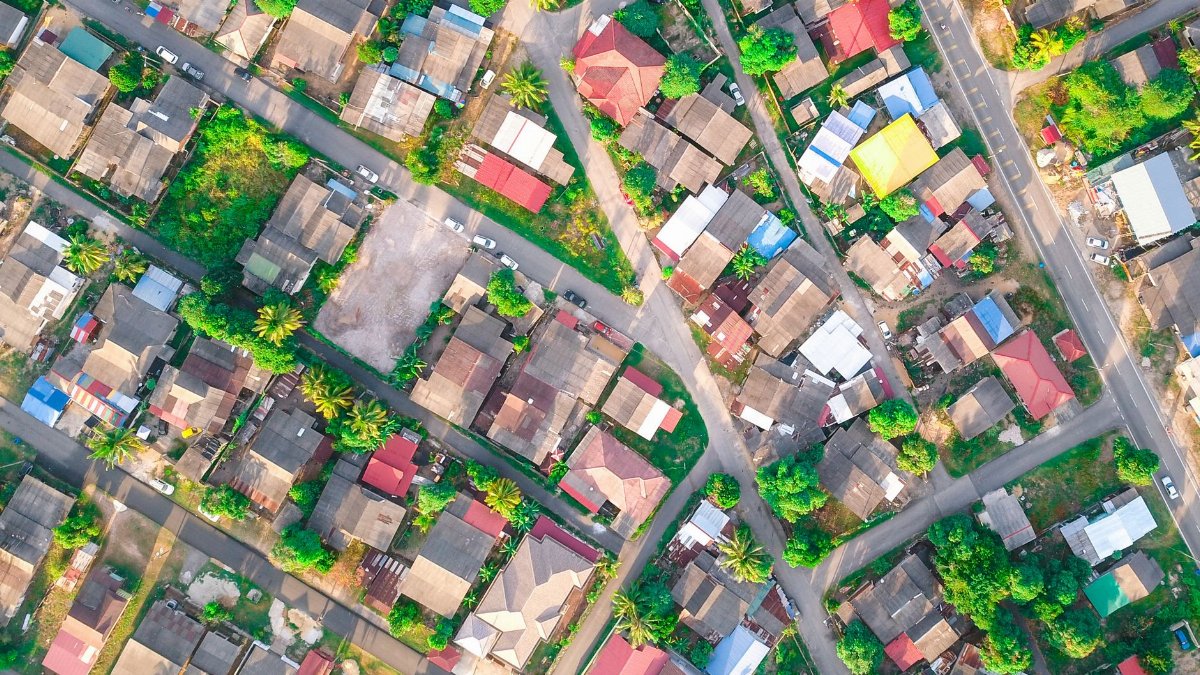
City agencies have started reviewing the tool outputs when prioritizing drainage improvements and buyout programs. Neighborhood associations use the data to advocate for targeted retention ponds or channel maintenance. Planners emphasize that better risk awareness supports more resilient building codes and green space allocations across sprawling suburbs.
Climate Trends and Future Projections

Regional studies indicate rising sea levels and shifting rainfall patterns could increase event frequency along the Gulf coast. Models within the platform allow users to toggle scenarios based on moderate or high emissions pathways. These forward looking views help families weigh relocation options or elevation retrofits for homes built decades ago.
Expert Perspectives on Expanded Mapping

Hydrologists at local institutions stress that no single map captures every variable yet layered approaches reduce surprises. They caution against overreliance on any one source while acknowledging the value of public access to refined datasets. Collaboration between academic teams and municipal offices has accelerated refinements to the underlying algorithms.
Practical Steps for Property Owners

Residents begin by visiting the public portal and comparing their address against multiple storm scenarios. Next steps often include consulting surveyors for on site elevation confirmation or contacting insurance agents with the generated reports. Some have formed small groups to share findings and push for collective drainage solutions in their subdivisions.